Embrace the DH Cycle: Solve Problems, Create New Problems, Get Help, Repeat

The Department of History’s Kevin Borg reflects on his journey into the digital humanities, sharing lessons learned through his development of increasingly sophisticated spatial history projects that enrich his teaching and scholarship and benefit other scholars and the general public.  
It all began with a half-dozen 2-foot by 2-foot map pages that I laid out on clustered desks in the classroom. Looking back at the decade-long journey that ensued, I can now see a repeating pattern, what I’ve come to call the DH cycle: solve problems in one’s research or teaching with a digital tool or process, discover or create new problems resulting from the solution, get help from collaborators on how to surmount the new problem, repeat. In short, solve problems, create new problems, get help, repeat. If I had been aware of this cycle when I began, I might have been more patient with myself and less discouraged when progress seemed slow. I summarize my journey here to encourage others in their own DH journey. Embrace the cycle and carry on.
The paper maps I laid out in class were the downtown blocks of our university’s home town printed from a microfilmed 1912 Sanborn Fire Insurance Map. When I unfurled them in the classroom, their details drew my students into the community’s history with a speed unmatched by any text I might have assigned. I had solved the problem of engaging college students with the history of a community in which they had not grown up. In the fall of 2007 and spring of 2009 my public history workshop on “Industry, Business, and Workers in New South Virginia,” did two things quite well: first, it employed historic Sanborn maps in the classroom to identify potential research sites and topics. Second, it forced students out into the community, into old buildings, into courthouse records, and into conversations with members of the community. Each semester the workshop culminated in a well-received, student-led walking tour for the public.[1] 

But each of those workshops highlighted the difficulty of working with historic maps that were either on microfilm, housed in the county library’s vault, or reprinted on very large paper. Those formats were neither easy to work with in the field, nor easy to collaborate around in class. Each workshop also highlighted the ephemeral nature of community engagement that essentially ended with the conclusion of the walking tour.  So, I began looking for ways to solve these problems, which lead me down a path toward DH.

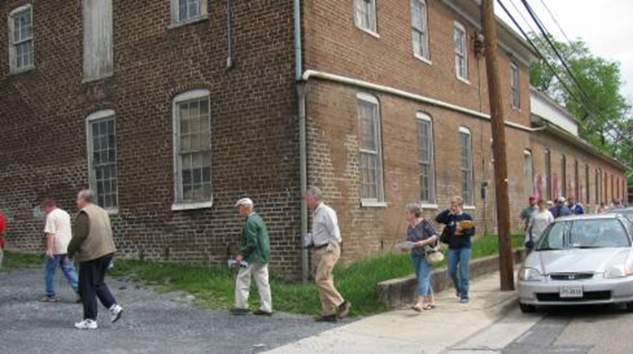
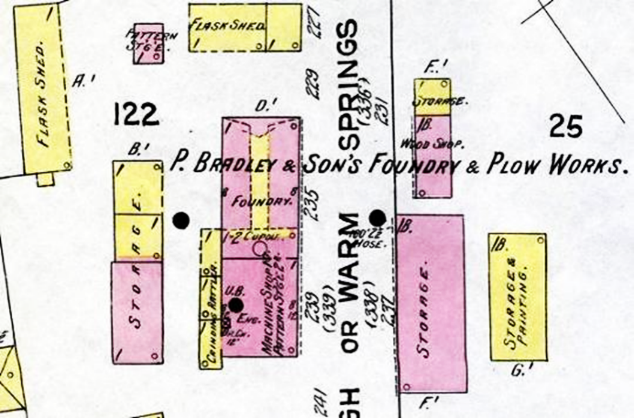
Our public walking tour rounds the corner of the machine shop of the P. Bradley & Sons Foundry, the center building in the 1912 map detail above.

In the first phase of my DH journey, I simply wanted to project the maps onto the classroom screen, rather than perch full sheets on desktops. This meant scanning high resolution images from the entire microfilm set of Sanborn maps for Harrisonburg. Then I needed a place to house them, and something better than PowerPoint to display and compare them side-by-side. The library and the art department had previously created a program to do just that, the Madison Digital Image Database (MDID). So I got permission to add the map images as a collection to the MDID system and planned to use that viewer in my class. But my ambition for what more we could do with these maps quickly outgrew the MDID system’s purpose and capabilities. In my mind’s eye, I could see quite clearly what I now wanted.

Becoming Geospatial

The emerging “spatial turn” in the humanities, and particularly within history,[2] inspired the second phase of my project. I wanted to make the digital versions of these historic maps viewable in an online environment where my workshop students could collaborate and directly analyze various years of maps displayed over contemporary satellite imagery with zoom and transparency functions. The result would also be freely available online so the public could explore the maps themselves, follow virtual versions of the students’ walking tours, and ask their own questions about the history of their community. What I could not see clearly was how halting and difficult it would be for me to gather the human and technical resources needed to pull it off, nor how much I would have to teach myself along the way. I knew about ArcGIS, the most common commercial Geographic Information System software used by industry and by large, mega-grant research projects in the humanities, but I had never used it. And it did not lend itself to tinkering and ad-hoc learning.  So, I hesitated.

Then when a geologist colleague offered a summer workshop on more advanced uses of Google Earth Pro, I believed I had found a way to avoid the complications of ArcGIS. I could import my map pages as image overlays and position them over modern satellite imagery. And if I could do that, I could use them in the classroom and even share them publicly. I saw in Google Earth a tool to solve my classroom map-use problem and my ephemerality-of-walking-tours problem. However, as I dove in I realized I needed to first work in Photoshop to edit the map pages, trimming the excess white borders where the map images would join into a mosaic of the whole. The DH cycle was beginning: the solution of Google Earth, led to the new problem of editing digital images. So, I got help with Photoshop from a colleague in the School of Media Arts and Design.

Repeat!

Once I had a few images edited and loaded as overlays in Google Earth, I realized the georeferencing functions in the program were insufficient to achieve the accuracy I needed to make the maps useful. I had a new problem. But ArcGIS promised a solution: I could “rubber-sheet” the map images to better conform to the contemporary satellite terrain, then bring them into Google Earth. So, I sought help from a friend in the Geographic Sciences department. He showed me the functions I would need to use in ArcGIS Desktop and set me up with Virginia base map imagery and street data covering the region of Harrisonburg. But I had a Mac and ArcGIS only ran on PC, so I had to bootcamp my Mac, get a copy of Windows, and run Windows and ArcGIS on the bootcamped side of my Mac. Then I spent a summer learning how to accurately georeference my map images as raster layers, balancing file size against image detail. I learned the pros and cons of image file formats, geographic coordinate systems, map projections, image tiling, and more. I felt overwhelmed at times using ArcGIS tools that I did not fully understand. It was a steep learning curve and I received much help and encouragement beyond my department and college. I had to get help and build working relationships beyond my home department, beyond my discipline. There was no other way.

Going Public

When I had finally added the multiple georeferenced and rubber-sheeted images into Google Earth to create completed mosaics of the 1886 and 1912 Sanborn maps, I felt that I had accomplished something. Zooming in to a single half-block section of the map then slowly fading the 1912 overlay from solid to transparent and back elicited “oohs” and “awes” from those to whom I showed it. But Google Earth had a distractingly complicated user interface. As I watched new users in the community try to view the historic map layers or explore the student research links, I realized I had a new problem. I needed a much simpler and more intuitive interface. I had a new problem.

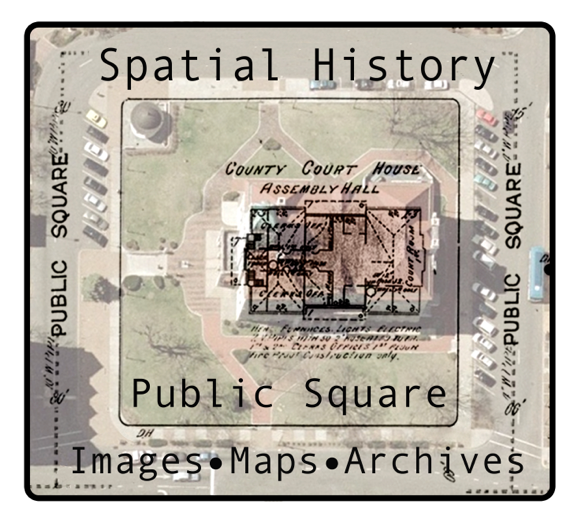
Thus began the third phase of my project, during which I named it, “Spatial History in the Public Square.” I wanted to make a custom geospatial interface that foregrounded the zooming, fading, and location pop-up markers. And I wanted the navigation bounded by the extent of the given map project, so that users could not get lost in the Pacific Ocean by accidentally scrolling the mouse too quickly. And I wanted to make it free to the public. Some well-known online spatial history projects were making impressive use of GIS and mapping programs. Yet as models, they were far too expensive and complicated for smaller, community-based institutions to duplicate and maintain. The time was right to bring these tools and methods within reach of communities with modest resources, to bring Spatial History into the Public Square.

I knew by this point that I needed more than collegial help to go any further. I needed to pay my collaborator so that s/he could focus on the project. I applied for and won a $4,000 Virginia Foundation for the Humanities Open Grant, which allowed me to recruit a recent graduate of our Geographic Sciences program to join the effort. Bradley had an eye for clean design and embraced the open source philosophy at the core of the SHPS vision. The result beautifully accomplished what I had envisioned and we presented it as a team at the 2016 National Council for Public History meeting in Baltimore and at local presentations in the community. Brad’s help solved the problem of Google Earth’s too-complex interface. Our presentations at the county library and the historical society confirmed our design choices, community members loved the simple, easy-to-use and understand interface.

Repeat!

Then a new problem surfaced. The combination of various open source code that made SHPS work so well, would not be easy for small organizations to adapt. They would need someone with a fairly robust knowledge of HTML, Java Script, and some GIS to customize it to their particular location or project. We created SHPS on a shoe-string budget relative to the typical, research universities’ GIS and spatial history projects, but it was still not a simple product to nativize in a new community. I had a new problem.
The fourth phase of the project, which is underway as I write this, is supported by a $16,000 Madison Trust Grant with which I have secured additional talented help. Brad accepted a full-time job in North Carolina, but remains a paid consultant when I need his GIS expertise. With the help of Kevin Hegg, head of our Library’s Innovation Services, I have contracted with Andreas, formerly employed at JMU and now living and working in Germany. Keeping the elements of the simple user interface of SHPS, Andreas redesigned the back end into a simple-to-build interface as well. The new web application is called pastmapr and I will be testing it in my public history workshop course later this semester. Once we are happy with how it works, the remainder of the Madison Trust grant will support hiring talented students to create instructional materials on building and customizing the pastmapr application. It will then be easy to launch spatial history projects anywhere in the world, for free. Then I anticipate a new problem will surface, and the DH cycle will begin anew.

Four Lessons for Doing DH at JMU

  1. DH projects often fall ambiguously between teaching and research, so the DH practitioner should be prepared to explain a project in terms appropriate to each realm. This was particularly problematic in the past. As my project evolved from merely wanting to view scanned map images in the classroom, to wanting to create and maintain a historical map project for the Harrisonburg community, I moved beyond the mission and expertise of instruction-oriented campus tech support. I was not creating an online course. I was not using clickers-in-the classroom. I was not requesting a WordPress site for a course. Today the dual teaching/research nature of DH at JMU is less problematic, largely due to the reorganization within the Library that replaced CIT with Innovation Services, and the soon-to-open Geospatial Commons in the College of Integrated Science and Technology. The environment for DH at JMU is supportive, but DH practitioners will still need to explain their projects ambidextrously.
  1. DH Practitioners will experience periods of difficult-to-measure productivity. Long and often steep learning curves in DH are difficult to sustain in the face of other demands and pressures. What you are learning is new to you and often requires significant time and attention. But, this stage does not produce new scholarship or research that can be published in one’s traditional academic field. Instead it takes time away from conventional research and publishing. Thus, DH remains risky for non-tenured faculty, who should seek clear administrative support in their home department in advance.
  1. DH depends on collaboration. There is no other way. Lone scholars do not succeed in DH. You cannot become proficient in each of the digital tools that will best suit your project’s goals. Digital tools change constantly, incessantly. ArcGIS went through a half-dozen versions in the time that I was rubber-sheet my map images. One must have collaborators who know the tools well.
  1. Collaboration is not free. DH projects are often born of collegial generosity, but they cannot mature in that space. Everyone at JMU is busy, as they should be. Small DH projects or early-phase work can be supported by small grants from various sources on campus. But sustained development of DH a project requires compensated collaborators. So, DH practitioners should develop grant-writing skills for external programs beyond the traditional, lone scholar humanities grants. And, as the Library’s Innovation Services department grows and the East Campus Geo-Commons opens, DH practitioners may find additional talented staff with dedicated time for collaboration on projects that are ready to grow beyond the germinal stage.

Endnotes

[1] See Kevin Borg, “Teaching with Historic Places: Sanborn Maps and Dusty Old Buildings” Notes on Virginia, Virginia Department of Historic Resources, number 52 (2008) pp. 40-46. https://www.dhr.virginia.gov/pdf_files/Notes_On_Virginia_08.FINAL.Web.pdf

[2] Clear, brief overviews of the spatial turn in history include Richard White, “What is Spatial History?” Spatial History Lab: working paper, Stanford University, 1 February 2010 (https://web.stanford.edu/group/spatialhistory/cgi-bin/site/pub.php?id=29 ); and Edward L. Ayers, “Mapping Time” in Geohumanities: Art, History, Text at the Edge of Place, eds., Michael Dear, et al., (Routledge 2011), 215-225.